Best Time to Call a Lead in India: 14,264 Calls, No Best Time
The famous best-time-to-call numbers come from a 2007 study of six US companies and web-form leads. We checked 7,989 outbound calls from Indian sales teams. The answer rate is flat all day.

Everyone Quotes the Same Number
Ask when to call a lead and you get an hour. Four in the afternoon. Wednesday, if the article is confident. Never one o’clock.
That number is not folklore. It traces back to a specific piece of work: the Lead Response Management study published in 2007 by Dr. James Oldroyd at MIT’s Sloan School of Management, with InsideSales.com. It looked at three years of data from six companies that generated and answered web leads, more than fifteen thousand leads and over a hundred thousand call attempts. It reported that 4pm to 6pm beat the worst block for making contact by 114 percent, and that 8am to 9am and 4pm to 5pm were the best hours for qualifying a lead, 164 percent better than 1pm to 2pm.
It is a real study and the direction it found, that calling sooner beats calling later, has held up since. But look at what it measured. Six companies, weighted towards technology and financial services. Leads that arrived through a web form, in the United States, in an era before every buyer had a mobile phone in their pocket and a reason to distrust an unknown number. It also measured the first call attempt rather than the first answer.
None of that describes a telecalling team in Indore working a list on Android handsets. So we checked.
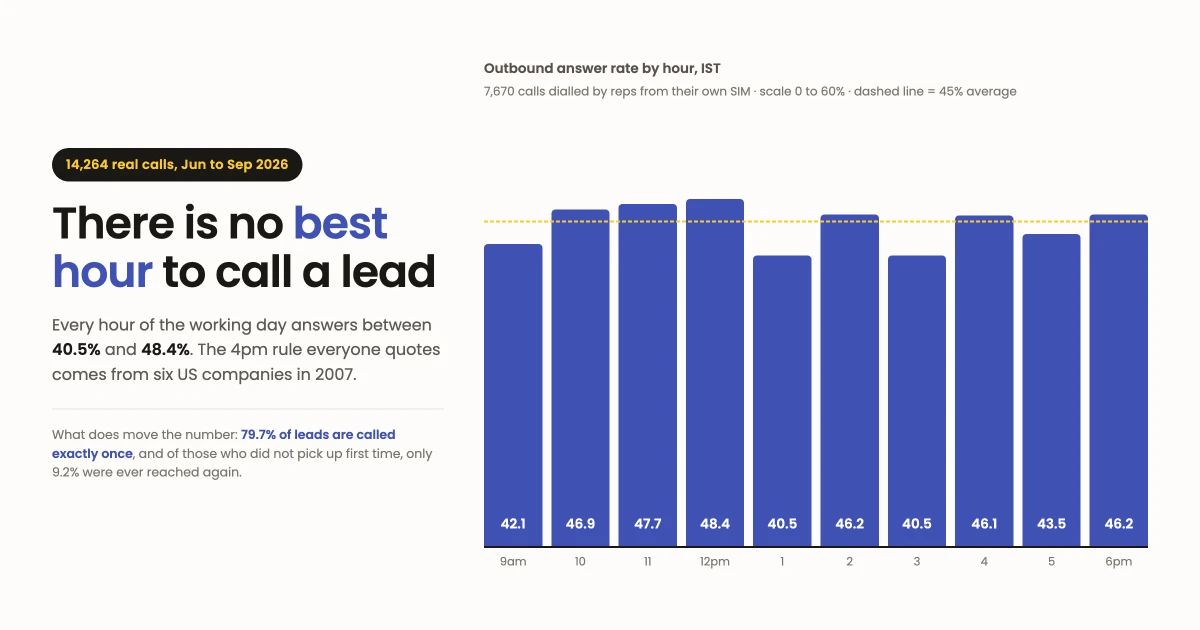
What 7,989 Outbound Calls Show
These are calls Indian sales teams dialled from their own mobile SIMs, logged automatically by the ViveLead Android app on to the lead being called. Outbound only, between 10 June and 27 September 2026. Hours are IST.
| Hour (IST) | Calls placed | Answered |
|---|---|---|
| 09:00 | 316 | 42.1% |
| 10:00 | 923 | 46.9% |
| 11:00 | 1,127 | 47.7% |
| 12:00 | 1,045 | 48.4% |
| 13:00 | 854 | 40.5% |
| 14:00 | 903 | 46.2% |
| 15:00 | 935 | 40.5% |
| 16:00 | 857 | 46.1% |
| 17:00 | 448 | 43.5% |
| 18:00 | 262 | 46.2% |
| 19:00 | 108 | 42.6% |
| 20:00 | 64 | 37.5% |
| 21:00 | 82 | 42.7% |
Hours outside this band are left out on purpose. Between 10pm and 8am the whole sample is 65 calls, and a 100 percent answer rate on six calls at 1am is not a finding.
Inside the band, the best hour and the worst hour are 8 percentage points apart. Among hours carrying at least 300 calls, the range is 40.5 percent to 48.4 percent. The 4pm hour, the one the 2007 study made famous, sits at 46.1 percent. The 1pm hour, the one it named worst, sits at 40.5 percent. That is about 14 percent better in relative terms, against the 114 to 164 percent gaps that get quoted.
Weekday does even less:
| Day | Calls placed | Answered |
|---|---|---|
| Monday | 1,050 | 44.3% |
| Tuesday | 1,257 | 46.2% |
| Wednesday | 1,761 | 42.4% |
| Thursday | 1,152 | 48.1% |
| Friday | 1,101 | 43.5% |
| Saturday | 1,364 | 46.5% |
| Sunday | 304 | 49.7% |
Sunday is nominally the best day and Wednesday the worst, which is the opposite of the usual advice, on a spread of 7 percentage points and a Sunday sample of 304 calls. We would not restructure a week around that, and neither should you.
What This Data Is, and What It Is Not
This is one call log, not a national benchmark, and the concentration matters: one team accounts for 73.7 percent of the calls, and the top three accounts for 90.8 percent. Read the tables as what real Indian telecalling looks like in a few high-volume teams, not as a population average.
The rest of the method, stated plainly so you can discount it properly:
- 14,264 calls across 9 customer teams, 10 June to 27 September 2026. Of those, 7,989 were outbound, which is the subset in the tables above.
- Internal ViveLead and demo accounts were excluded. They are not customer behaviour.
- Every bucket is computed in Asia/Kolkata. Our database stores instants in UTC, so reading the raw timestamp would shift every hour by five and a half hours and produce a confident, wrong answer.
- Answered, missed and rejected come from the handset’s own call log, not from a rep ticking a box.
- All figures are aggregate. No company, lead, rep or number is identified anywhere in this piece.
The Number That Actually Moves
While we were in the data, a different figure turned up that nobody writes listicles about.
Of 5,806 leads that received at least one outbound call:
- 79.7 percent were called exactly once. Four out of five leads got a single attempt in their whole life.
- The first attempt connected 46.1 percent of the time.
- Across all attempts ever made, 51.0 percent of leads were reached. So every retry in the entire dataset added about five percentage points.
- Of the leads whose first attempt did not connect, only 9.2 percent were ever reached on a later call.
- 2,845 leads were never connected at all.
Read those together. The retry lift looks tiny, but that is not evidence that retrying does not work. It is evidence that retrying almost never happens. Four in five leads never get a second call, so there is no second attempt to lift anything.
That is a much larger prize than an hour of the day. Roughly half of a list does not answer the first time. If a team calls those leads once and moves on, the hour they chose is irrelevant, because the same leads would not have picked up in any hour.
An Answered Call Is Not a Conversation
One more number worth having before you set a target on connect rate. Of 3,611 answered outbound calls that carried a duration:
- Average length: 68 seconds
- Under 30 seconds: 45.0 percent
- Between 30 and 60 seconds: 25.6 percent
- Over three minutes: 7.1 percent
Nearly half of the calls counted as answered were over inside half a minute. Some of those are a pickup and an immediate hang-up, some are the wrong person, some are a bad moment. Only one call in fourteen ran long enough to be a real conversation.
If your dashboard reports connect rate and nothing else, it is telling you that 46 percent of your calls worked, when something closer to 7 percent produced a discussion.
What To Do Instead of Picking an Hour
- Count attempts per lead, not calls per rep. Calls per rep rewards dialling the easy leads again. Attempts per lead shows you the ones who were written off after one ring.
- Put every no-answer back in front of the rep with a time on it. Half of any list will not answer first time. A no-answer is not an outcome, it is an unfinished job.
- Measure talk time, not just connects. If 45 percent of your answered calls die under 30 seconds, connect rate is flattering you.
- Spread attempts across different hours rather than hunting the best one. The tables above say the hour barely matters, and the same lead unreachable at 11am may simply be busy, not unreachable.
- Stop paying for a time-of-day theory. Any tool sold on the promise that it knows the golden hour is selling you an 8 point spread measured somewhere else.
How We Know This
Every number here comes out of ViveLead’s own call log. Reps dial from their own phone, keeping their own mobile number, and the ViveLead Android app writes the call on to the lead with duration, direction and outcome. Nothing routes through us, so there is no per-minute bill, and it is on every plan from Rs 499 per user per month. How SIM call tracking works, including what recording does and does not do on a given handset.
That is also why we could ask this question at all. A CRM that depends on a rep typing what happened cannot tell you the answer rate by hour, because the rep does not type it. A log the handset produces can.
We will run these numbers again as the sample grows and as it stops being so concentrated in one team. If the flat line breaks, we will say so here.
Frequently Asked Questions
What is the best time of day to call a lead in India?
In our log, no hour is clearly better. Every hour from 9am to 9pm IST answered between 40.5 and 48.4 percent across 7,989 outbound calls. Among hours carrying at least 300 calls the spread is under 8 percentage points. Attempts per lead moved outcomes far more than the time of day did.
Where does the famous 4pm statistic come from?
The Lead Response Management study, 2007, by Dr. James Oldroyd at MIT’s Sloan School of Management with InsideSales.com. Three years of data, six companies answering web-generated leads, over fifteen thousand leads and a hundred thousand call attempts, weighted towards technology and financial services. It reported 4pm to 6pm as the best contact window, 114 percent over the worst block. It measured US web-form leads and first attempts rather than first answers, so the multipliers are dated and specific to that setting even where the broader direction still holds.
How many times should you call a lead before you stop?
More than once, which is the part teams skip. Of 5,806 leads called, 79.7 percent got exactly one attempt. First attempts connected 46.1 percent of the time and 51.0 percent of leads were eventually reached, so all retries together added about five points, because retries barely happened. Of the leads whose first attempt failed, only 9.2 percent were ever reached later, and 2,845 were never connected at all.
What is a normal answer rate for outbound calls in India?
About 46 percent of outbound attempts in this sample. Across both directions, roughly half of all logged calls ended with no answer. Treat it as one log, not a benchmark: 9 teams, one of them 73.7 percent of the volume. Your own rate depends on the list, its age, and whether the lead expects you.
Does an answered call mean the rep spoke to the lead?
Often not. Of 3,611 answered outbound calls with a duration, the average was 68 seconds and 45.0 percent ended inside 30 seconds. Only 7.1 percent passed three minutes.
Can I see these numbers for my own team?
Yes, that is what the call log is for. Install the ViveLead Android app on your reps’ phones and every call on their SIM lands on the lead with its duration, direction and outcome. Attempts per lead and talk time then come out of your own data rather than someone else’s study. SIM call tracking is on every plan from Rs 499 per user per month, and there is a 3-day trial.
Related reading
- SIM call tracking, in detail. How a call on the rep’s own phone lands on the lead, and the honest limits.
- AI dialer software guide. What auto-dialing, AI calling and call logging each actually do.
- TeleCRM alternative. If you are comparing telecalling CRMs on price.
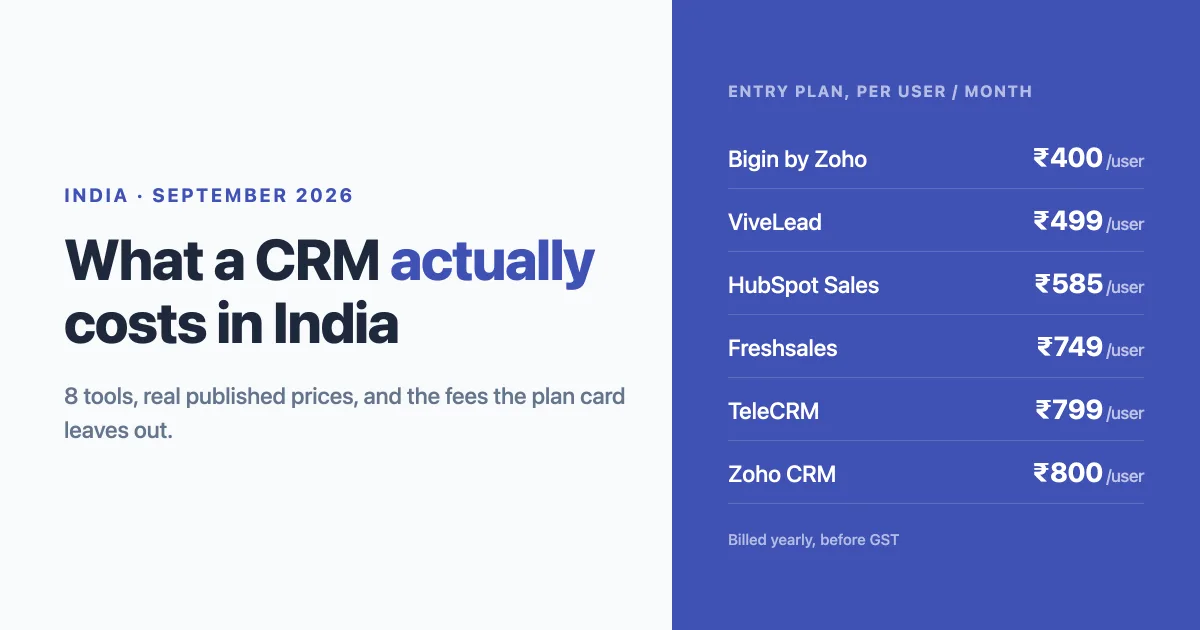
- CRM pricing in India. What eight tools cost per user, each figure dated.
Stop Guessing Which Hour to Call
ViveLead logs every call your reps make from their own phone on to the lead, so you can see attempts per lead instead of arguing about time slots. From Rs 499 per user, 3-day trial, no card.
Continue Reading
CRM Pricing in India 2026: What 8 Tools Actually Cost Per User
Real published INR prices for Zoho, Bigin, Freshsales, TeleCRM, Kylas, HubSpot, Salesforce and ViveLead, read off each …
WhatsApp Broadcast and SMS Rules India: Send at Volume Without Losing Your Number | ViveLead
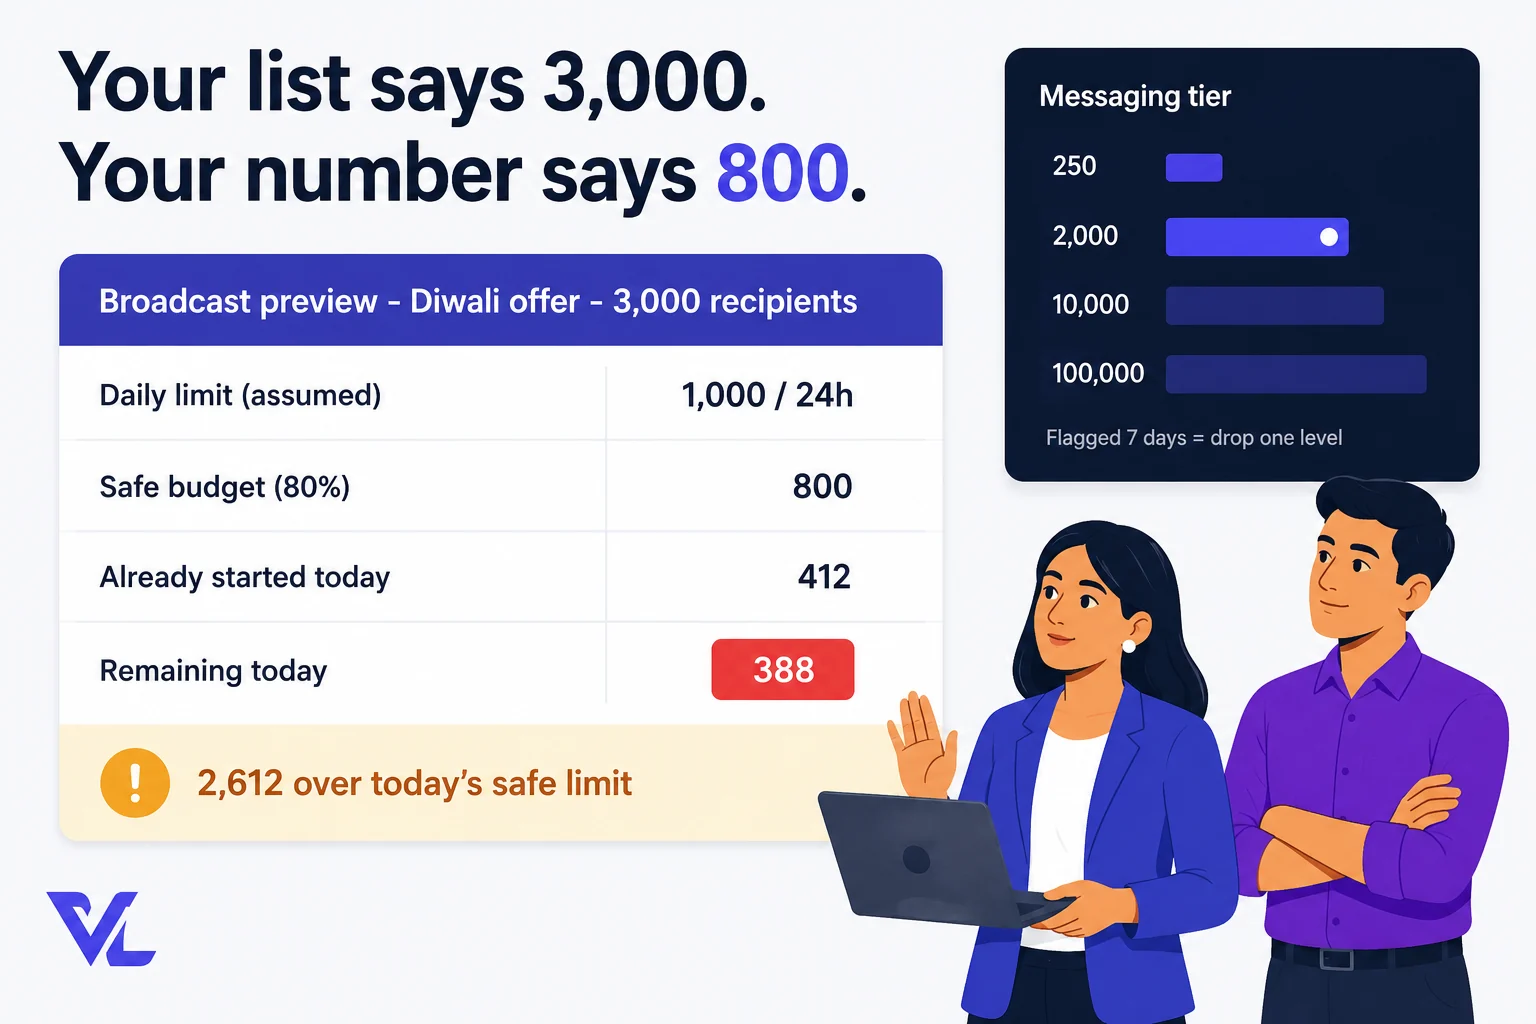
The three WhatsApp limits that decide whether a broadcast lands, why retrying a failed message makes it worse, and the …
Student Engagement Platforms: Personalized Outreach
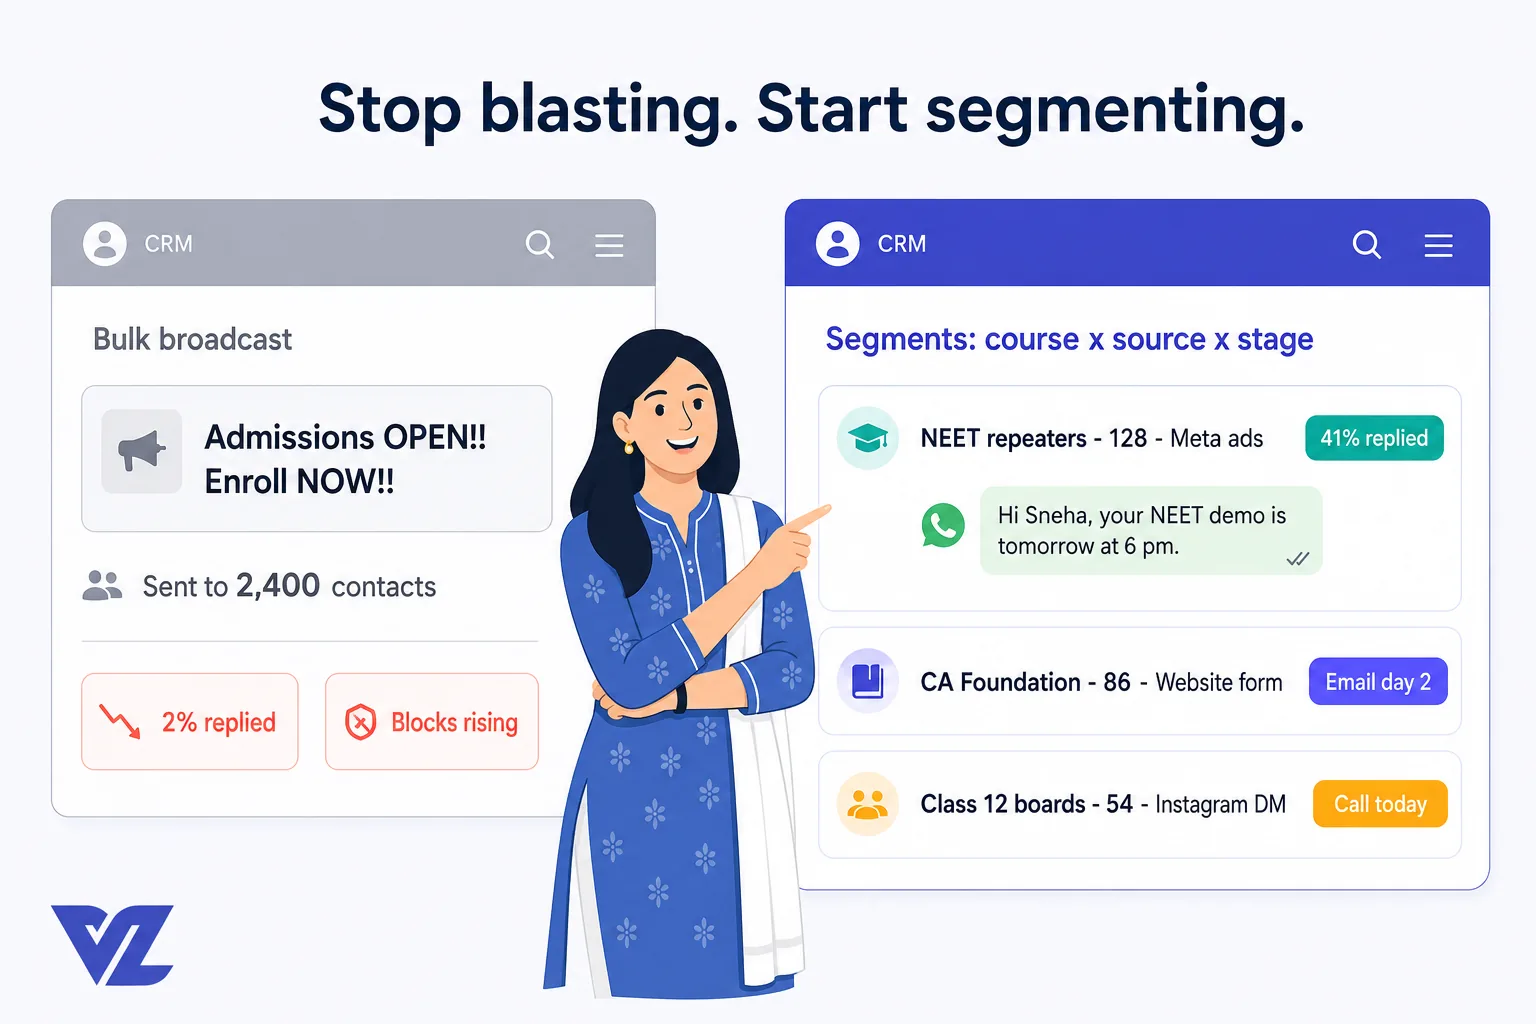
Student engagement platforms hide two products. Pre-enrolment personalized outreach automation is CRM work: segments, …